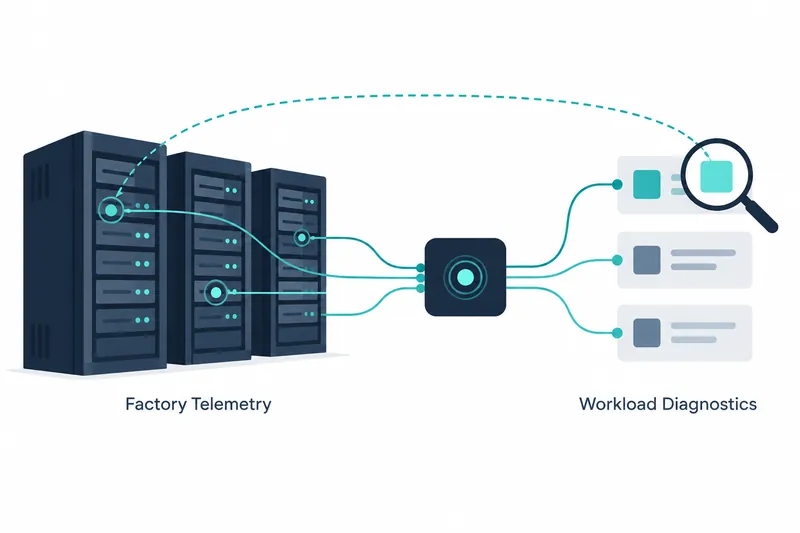
NVIDIA Minerva is an operations platform that combines signals from GPUs, networks, storage, and workload schedulers to show which workloads are affected. AI factory operators can investigate and respond by examining equipment and paths tied to workload degradation, rather than searching equipment alerts separately.
1. From equipment health to workload impact
Distributed training, which spreads computation across devices, proceeds at the pace of the slowest device. Subtle faults that appear only under load can slow an entire workload without stopping a device, and one fault can trigger signals and alerts across multiple devices.
Minerva collects metrics, numerical health measurements, logs, and connectivity data from GPUs, switches, network cards, storage, and schedulers. It automatically discovers relationships to build a knowledge graph mapping equipment to workloads. NVIDIA's technical blog says it processes billions of metric and log data points per hour.
This structure lets operators narrow an investigation from an anomalous interface to its node, network path, and affected workloads. They can also start with a workload identifier and trace GPUs, hosts, network devices, and related logs. The approach centers on workloads instead of navigating separate equipment dashboards.
2. Detecting known faults and unfamiliar anomalies
Supervised models identify known critical faults and link them to remediation guidance. Unsupervised models find patterns without labeled answers, comparing behavior lacking a predefined fault signature with similar equipment. Examining temperature, power, clocks, utilization, and workload status together can reveal degradation relative to peers, even within specifications. Natural language processing also detects new patterns in logs.
According to NVIDIA, Minerva found one degraded NVLink connection among roughly 400,000 interfaces in a data center running concurrent multi-node training workloads, then identified the affected workloads. Diagnosis took minutes rather than hours. Operators removed the faulty node from scheduling, reassigned workloads, and isolated the link for repair.
3. Grouping multiple alerts into one incident
A correlation engine uses equipment topology to connect signals and identify causes. It groups events and anomalies sharing dependency paths, where one device's state affects others, into a single incident. NVIDIA reports substantial reductions in notifications and tickets in supported scenarios. Operators can identify causes within a narrower scope, then respond through the platform interface or existing workflows.
According to NVIDIA, in a case where a switch restart spread congestion, 81 events and anomalies, including received pause frames, were grouped into one incident. NVIDIA estimates this reduced repair time and saved about 54 hours of cluster uptime.
In another case, an NVMe storage device failed to wake from a low-power state, causing I/O errors that slowed workloads on its node. NVIDIA estimates that identifying the cause, excluding the node from scheduling, and returning the faulty device saved 5,530 hours of workload runtime.
Sherlock, a conversational assistant, uses real-time telemetry and the knowledge graph to answer questions about why a workload is delayed or which equipment has changed state. External AI tools can query the same operational information through an MCP server.
4. On-site collection, central analysis, and deployment requirements
The collector stack runs on-site because it needs direct access to monitored equipment. It supports both pull and push data collection, while the platform stack handles relationship modeling, enrichment, machine learning, storage, and display. Collectors can also run in each data hall with the platform operated separately.
The 1.0.1 guide specifies minimum per-node requirements for a test cluster: 64 virtual CPUs, 128GB of memory, and 1TB of disk space. These requirements apply to a test environment integrated with a single rack or 10 Spectrum switches.
However, the release notes for that version state that cloud and as-a-service deployments are not supported. The MCP server for connecting external tools is a beta feature and is read-only.
This approach reduces investigation time by linking scattered data and alerts to workload context, but requires on-site collection infrastructure and management of storage and processing resources. Resource needs also increase with retention settings and data volume.
The following request example from the guide marks equipment registered in the network model as under maintenance.
curl --request PUT \
--url "https://<platform-host>/minerva/api/v2/network/leaf01" \
--header "Content-Type: application/json" \
--header "X-Api-Key: <api-key>" \
--data '{"status":{"admin_state":"MAINTENANCE"}}'
5. Retention periods vary by data type
The guide's collection status documentation lists typical retention periods by data type. General metrics and events are kept longest, while packet-level events are kept for the shortest time. The available historical window therefore depends on the type of data being investigated.
Table: Typical retention periods by data store
Conditions: Typical retention periods by data source in the NVIDIA Minerva 1.0.1 guide
Unit: Days
| Data store | Retention period |
|---|---|
| General metrics and events (raw_v1) | ~120 |
| Packet-level drop events (packet_v1) | ~7 |
| System log-based time series (syslog_v1) | ~30 |
| Components, queues, links, etc. (system_v1) | ~10 |
| Per-interface metrics (interface_v1) | ~10 |
Minerva's core value is linking equipment signals to workload impact, enabling more focused and faster starts to AI factory fault investigations.